
Have we turned a corner on traffic violence in Milwaukee?
Have we turned a corner on traffic violence in Milwaukee?

For the last couple years, I have been pretty vocal in raising a red flag around the worsening traffic violence conditions in Milwaukee. Walking the streets of the city, you could see and feel a degradation in the conditions facing pedestrians and cyclists. There was a notable uptick in TV coverage of serious injury crashes and deaths on our streets. And when you looked to the data, it confirmed all our worst suspicions.
Annual crash fatalities in Milwaukee County had increased from 53.6 per year (2007 - 2013) to a startling 101 fatalities in 2020.
Chart 1: Count of Fatal Accidents, Fatalities from 2007 to Current. (2022 data has been annualized based on 10 months of reporting.)
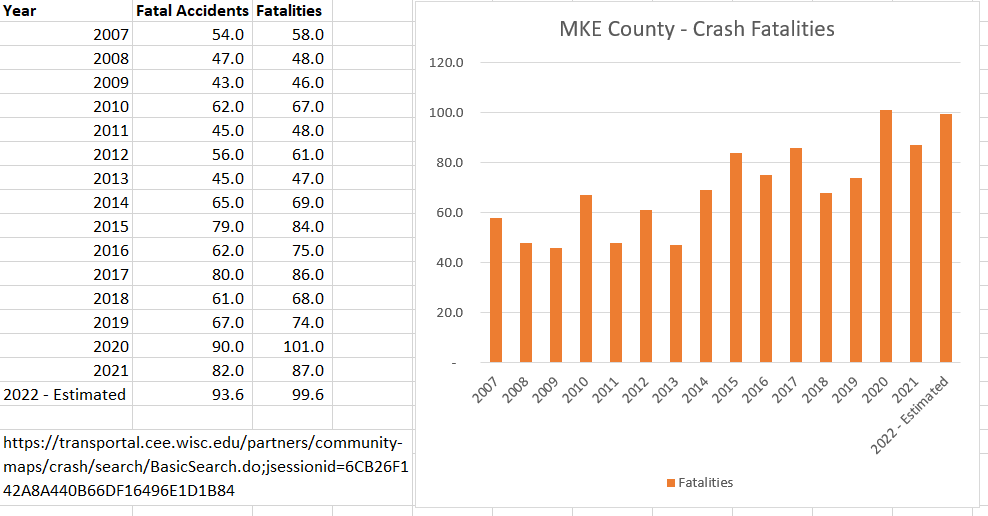
(Fatality Data: https://transportal.cee.wisc.edu/partners/community-maps/crash/search/BasicSearch.do;jsessionid=6CB26F142A8A440B66DF16496E1D1B84)
Fatalities, of course, are still somewhat of an outlier event and can be impacted by a degree of randomness. But a near-doubling in the number of annual crash fatalities in a decade is something that should give everyone - citizens, representatives, traffic & civil engineers, police - serious pause.
Anyway, I dug a little bit further. If fatalities might be skewed by randomness, a high frequency indicator like total crash incidents could not be. Fortunately, the City of Milwaukee makes their crash database publicly accessible. The database is just a raw list of every crash reported in the city from the smallest fender bender to the worst wrecks.
And it shows a very similar pattern as in fatalities. From 2008 to 2013, the city averaged 931 crash incidents per month. By 2021 that had shot up to 1,427 crash incidents per month, an increase of an astronomical 53%. But look at that sustained decline since the beginning of the 2022?!
Chart 2: Crash incidents per month - City of Milwaukee

(Crash Incident Data: https://data.milwaukee.gov/dataset/trafficaccident/resource/8fffaa3a-b500-4561-8898-78a424bdacee?inner_span=True)
Conclusion
We had a huge surge in crash incidents from about 2014 to 2018. Fatality data reflects the same surge. Then we had a sustained period of high accident rates from 2018 to 2021. But since the beginning of 2022, the trend has turned notably downward in crash incidents. October 2022 had incident levels similar before the surge.
Have we started to turn a corner on traffic violence? I hope so!
Let me know what you think in the comments and don’t forget to subscribe.